
Once again, I’ve got the data on member participation in NRA elections. Unlike attendance, these stats aren’t record breaking – not the lowest, not the highest. Just about average.
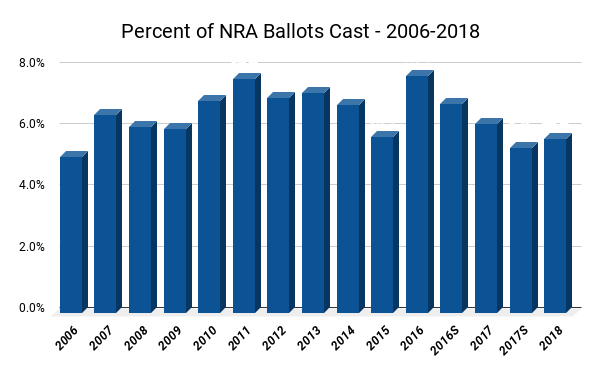
In terms of total votes cast, 5.67% of eligible voters who received ballots returned them. That’s on par with previous years, as you can see in the chart. The lowest vote participation I’ve ever documented in 2006 was 5.12%, and the highest was the 2016 regular board election at 7.76%.
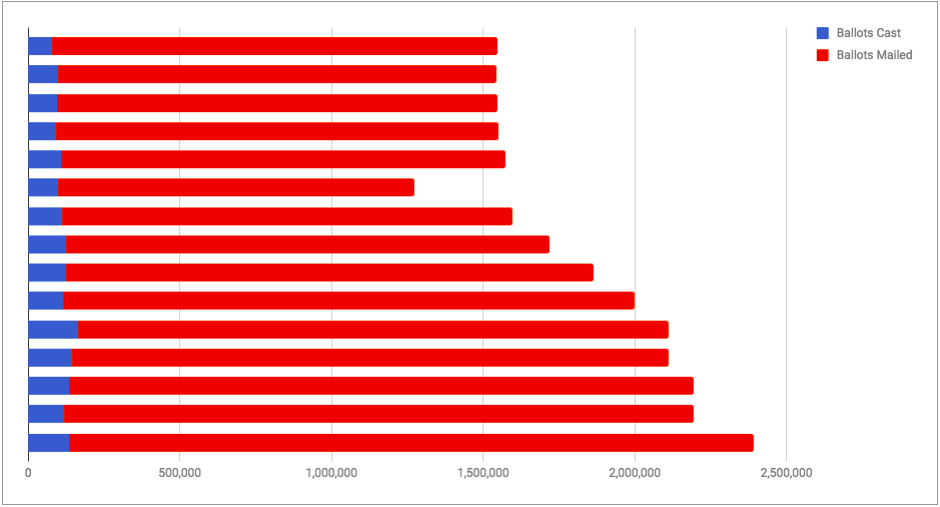
Of course, there’s also the context to consider of how many ballots went out. As we add more voting members to NRA’s member roster, it becomes harder for any one board member to reach individual voters who may feel inspired to vote after meeting with them or learning more about them. This is the record number of ballots mailed based on my data – 199,245 more than last year. That means more life members and members who have stuck with the organization for at least 5 consecutive years.
Of course, these charts just look at ballots returned. Of the ballots mailed back, 3.98% were invalid for a variety of reasons. This is up a bit from the last few years, but down substantially from 2013. Unfortunately, they stopped separating out my favorite invalid statistic – ballots from previous years. Who has these and remembers to send them in during the exact voting period the next year?? Last year, it was 24 people.
At first glance, I thought that people may be voting for fewer than 25 candidates, as the top vote getter this year (Ronnie Barrett) was only on 71.7% of valid ballots. That’s the lowest percentage I’ve recorded. The previous low was 2015 at 76.52%, so the same cycle of candidates. Most of the other lows I’ve recorded have also been during this same cycle of 3 year terms, so I think it’s just the lack of a really huge celebrity that spreads out votes more. (That’s not a bad thing!)
For the “last winner,” the lowest vote getter to still get a seat on the board, there were some interesting observations. The last winner was on just over half of the ballots – 54.46%. That’s not the lowest percentage I’ve seen, but the 2nd lowest and definitely close. What is more interesting is that those who did not win seats were much farther behind the pack than I’ve ever documented before. In my years of data, the top person who still lost is usually just under 1,000 votes away from the person above. This year, that gap was huge at a difference of more than 3,000 votes. So those who didn’t make it on the board this year were much farther behind as a group than they have been in at least a decade.
This was literally my first year of getting an NRA ballot. And I did participate.
I was surprised that they managed to turn around my membership in time to send me a ballot this year. IIRC that was how I knew they had actually enrolled me as a Life Member beyond them charging the card. I got the ballot before I got the “Welcome to” email…
If they were that fast getting ballots out this February, then that likely explains why the participation rate wasn’t spectacularly high. Too many new eligible voters who are less likely to know candidates in this election cycle.
I re-joined the first week of March. The ballot came a week or two later, maybe?
The general belief about electoral participation is that there is a strong negative correlation with satisfaction about the way things are going. In this case, of course, it would be satisfaction about NRA activities, not general satisfaction with the state of affairs in the country.
I’d like to see someone (more qualified to the task than myself) to study the NRA balloting scheme and write an article informing members how best to vote for their interests. And, then, when the candidates become available each year, apply this analysis to the candidates.
Each member eligible to vote can vote for up to 25 candidates; but, it is best to vote for a much smaller number. The NRA’s scheme seems to encourage members to vote for prominent names they recognize notwithstanding that these candidates will win enough votes to be re-elected without their votes.
A member should refrain from voting for any candidate who will almost certainly win anyway. Instead, he should vote for candidates who might win if they got just a few more votes.
I wonder if it would be better to avoid voting for candidates whose chances of wining are so remote as to be futile.
With an analysis and strategy, my wished-for someone could list the candidates each year:
– eliminating those who will win without another vote
– eliminating those who would not win even with all their supporters voting for them
– pointing out those candidates who appear to be competitive based on past performance, active campaigning, currency of issues
– pointing out endorsements of interest groups.
Following this advice, I would refrain from voting for some “star” who doesn’t need my vote; likewise I wouldn’t waste my vote on my favorite lost cause. I’d narrow my choices to those who need a few more votes to ensure their re-election and those who are likely to win if they got a few more votes. From among these, I’d choose those endorsed by interest groups whose preferences I share; e.g., maybe hunting rather than marksmanship (or vice versa), or training vs. legislative action (or vice versa).
Do we see anyone – or any group – who might understand the “political science” of the NRA’s voting scheme? Someone – or group – who might assemble the historical ballot results from previous elections? Someone – or group – who might compile the endorsements of interest groups?
I know I’ve seen data for the 76th seat election this year, but I’m curious how it compares to previous years. Has participation in the 76th seat race been increasing, or has it been stagnating?
That is not included in the report filed during the Annual Meeting since voting is still open at that time.
I will see what I can get, but it will probably be a while since they aren’t prepped and printed like the main results.
“those who did not win seats were much farther behind the pack than I’ve ever documented before.”
Does anyone have an analysis of whether there was a characteristic or qualitative difference between winners and losers that might explain that?
I’ve been an annual member since late 2012, and have been making Easy-pay life member payments for a little over a year now, and I didn’t receive a ballot. I’m guessing I don’t count as a life member until I’m paid in full (understandably), but I thought my continuous membership of 5 years was supposed to qualify me.
I believe it does qualify you because I recall voting while I was EPL once I had been a member for 5 years. Granted, it sounds like if you’re absolutely sure that you hit 5 years this last winter, it may be a timing issue. You should call member services to ask about your voting member status since you’ve been a consecutive member. If there are any breaks or hiccups, they can tell you.
When are the election results announced?
Like every year, they were announced at the annual meeting of members. The winner of the 76th board seat is announced at the end of that day well after voting closes, usually at an evening event.
I thought they might have been available, but then when I googled I found nothing. And I looked over this post a few times figuring I must have missed the link to them or something, but no dice. So I figured the full results weren’t available and maybe you just had the highlights.
They don’t publish them online. I believe they are published in member magazines at some point, though I haven’t looked at a magazine in ages to actually confirm it.
Here’s a theorem to consider and disprove if possible. In any given election, 100% of people that are informed and interested in the outcome will cast a vote.